This page provides examples of the various applications supported by the LumiDISP – LDA ML7 system. For detailed information regarding measurement of UGR and light pollution, please visit their respective dedicated pages.
APPLICATION LIST OF THE LUMIDISP - LDA ML7 SYSTEM
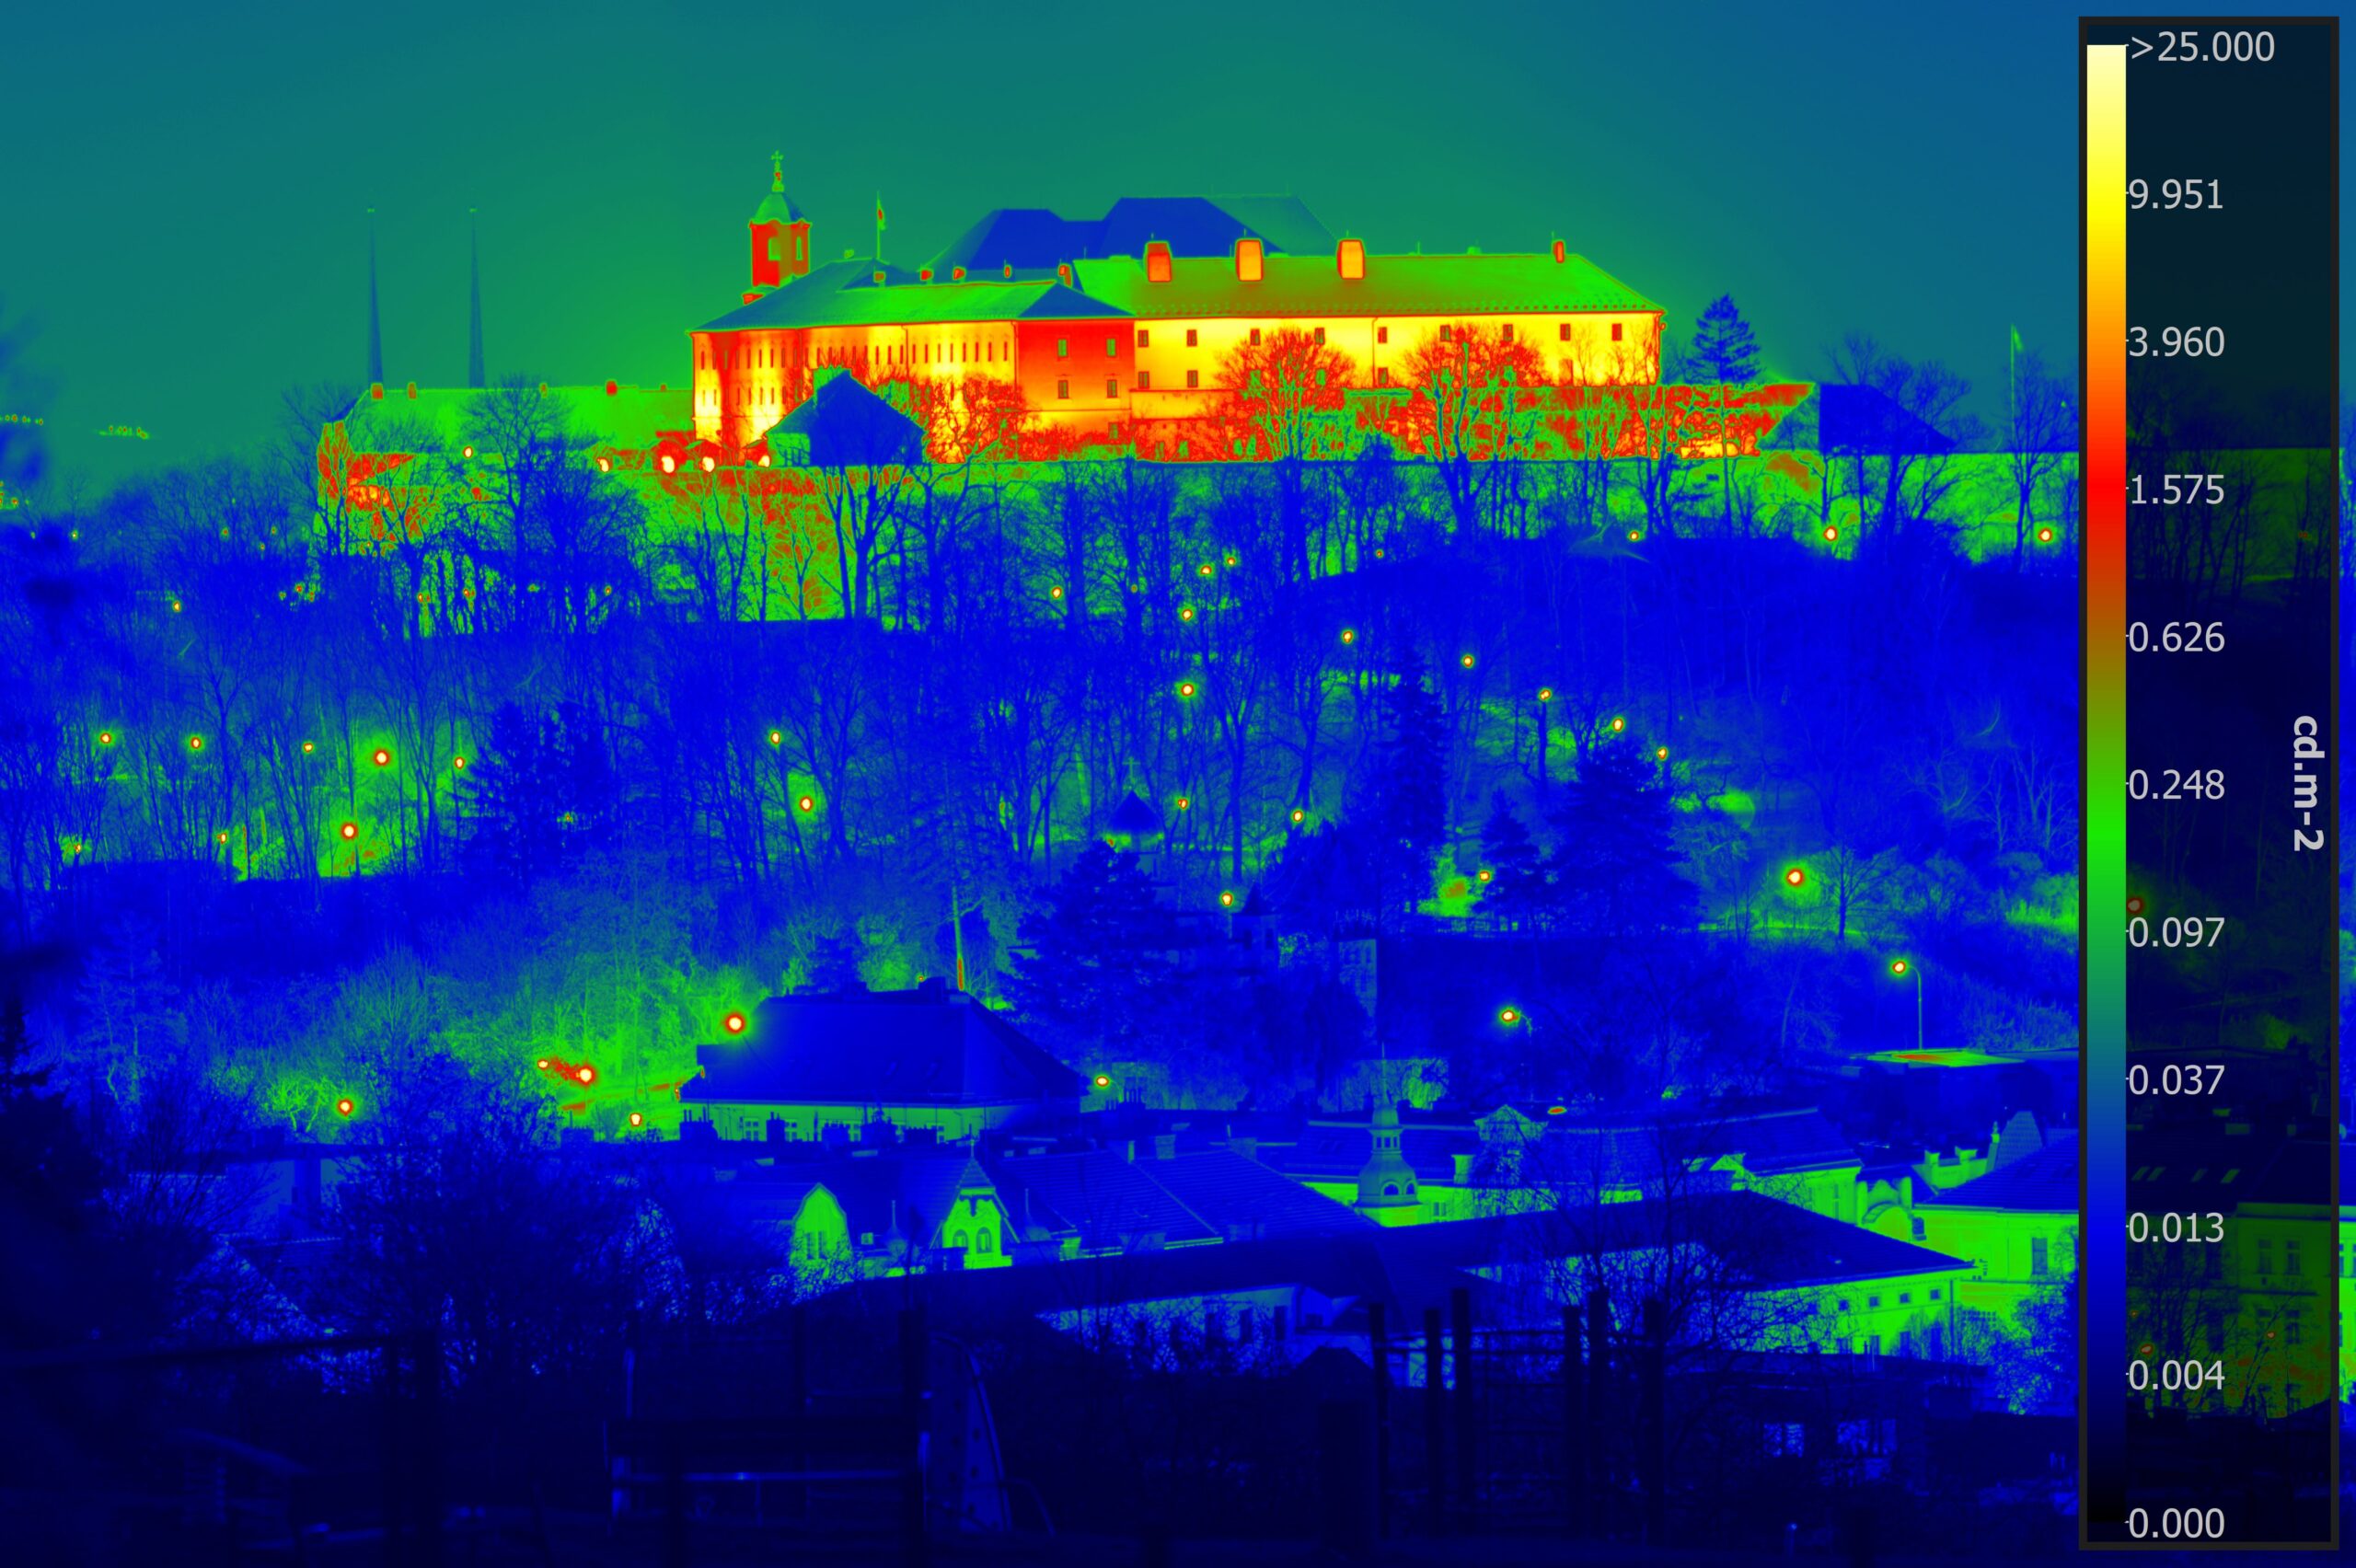
Luminance Distribution Measurement
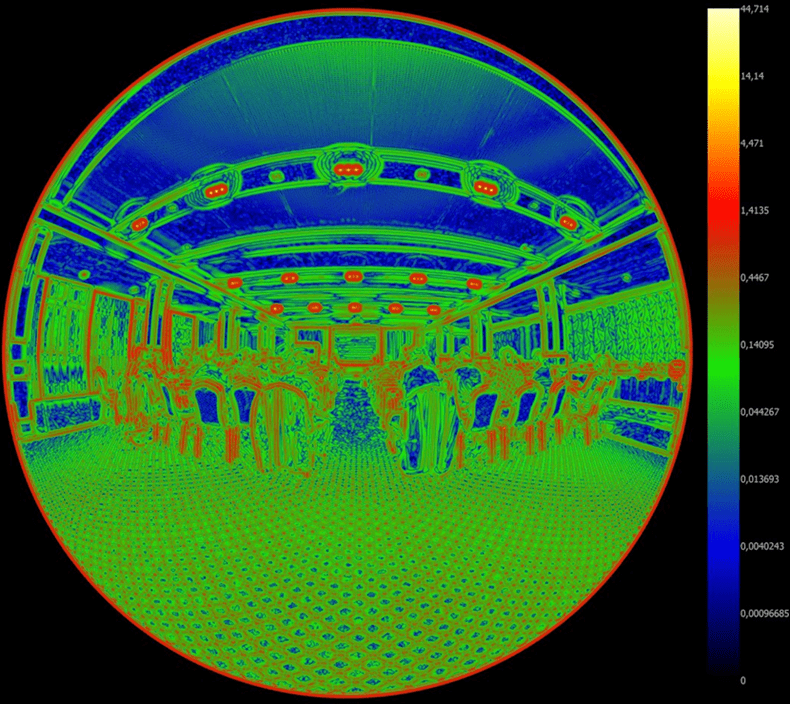
The fundamental application of our system is analysing the distribution of photometric luminance (cd.m-2). Unlike conventional spot measurements, the luminance analyser provides more than just a visual record—it delivers a comprehensive map of luminance across the entire scene. This eliminates the need for complex documentation of measurement locations. The resulting image clearly shows exactly what was measured, allowing you to extract precise luminance values for any specific point or area directly from the luminance map.
While luminance is independent of observation distance, it is highly dependent on the viewing angle. The luminance of a specific surface can change significantly depending on where it is observed from. Therefore, during measurement, the device should be positioned at the exact vantage point of the intended observer. To capture the observer’s complete field of view, the use of wide-angle lenses is highly recommended.
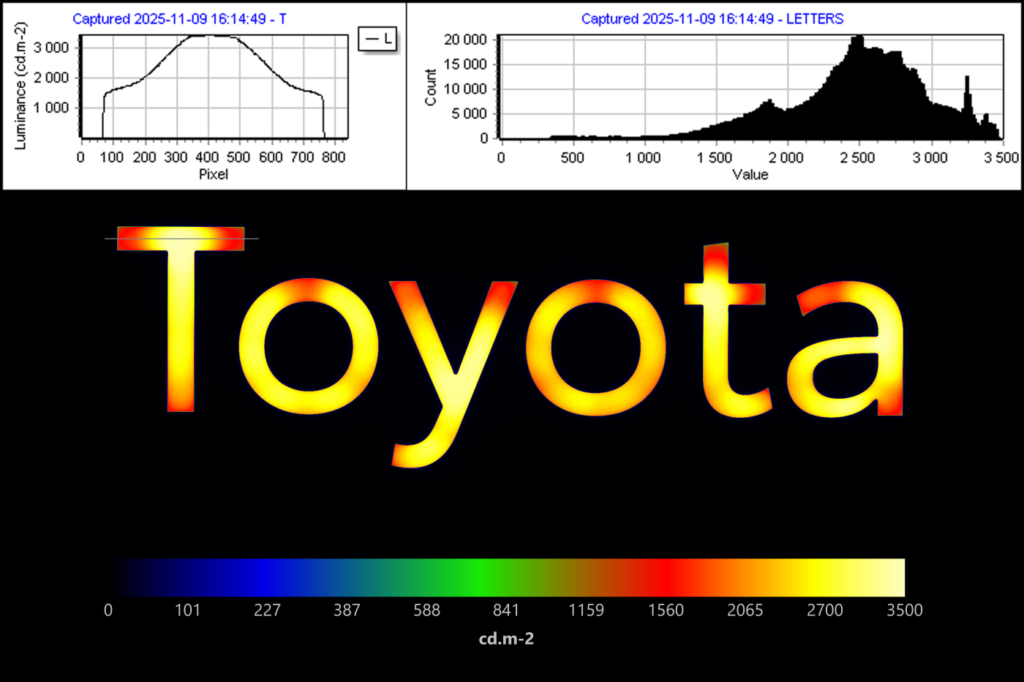
Luminance Uniformity and Slices
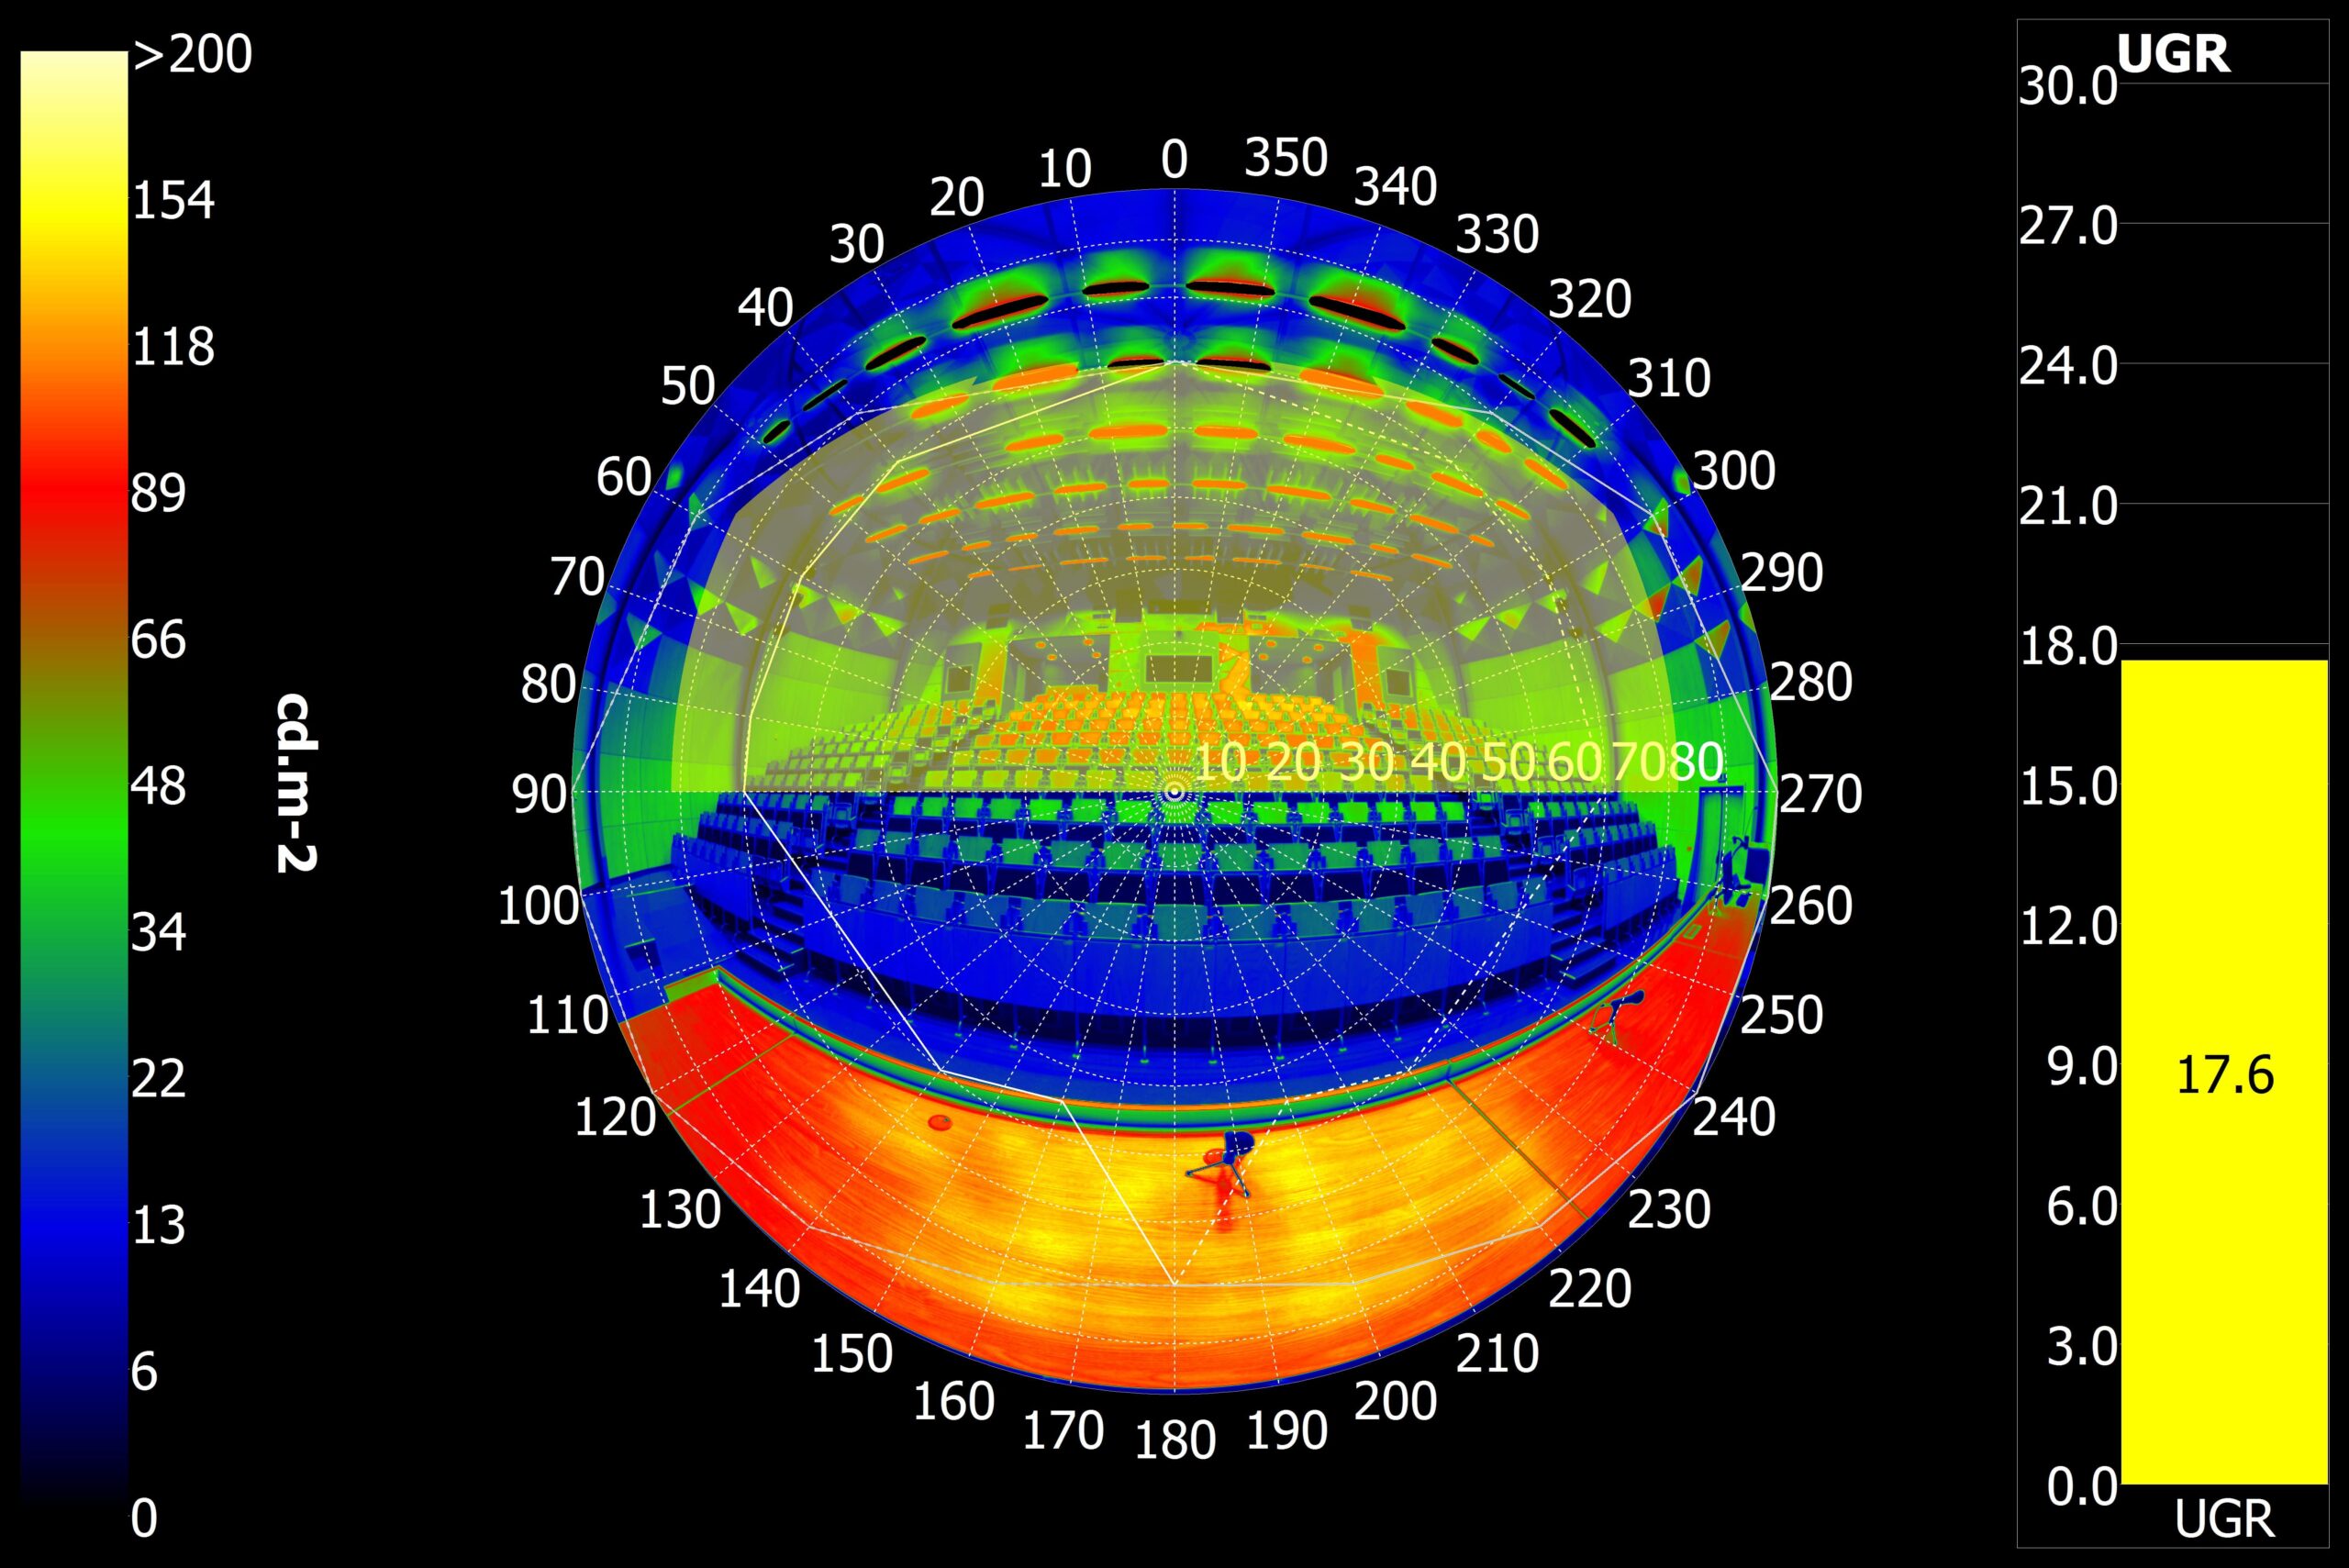
One of the most common metrics for evaluating luminance distribution is luminance uniformity. Luminance levels within the field of view should not be excessively high or low compared to the average. However, adequate luminance contrast is essential to ensure the readability and visibility of observed details.
By analysing luminance along a specific line, you obtain a luminance slice. This represents the variation of luminance along a precise path. With LumiDISP, you can analyse these profiles not only using relative image coordinates but also in polar coordinates, allowing you to determine exact spatial orientation through angular calculations.
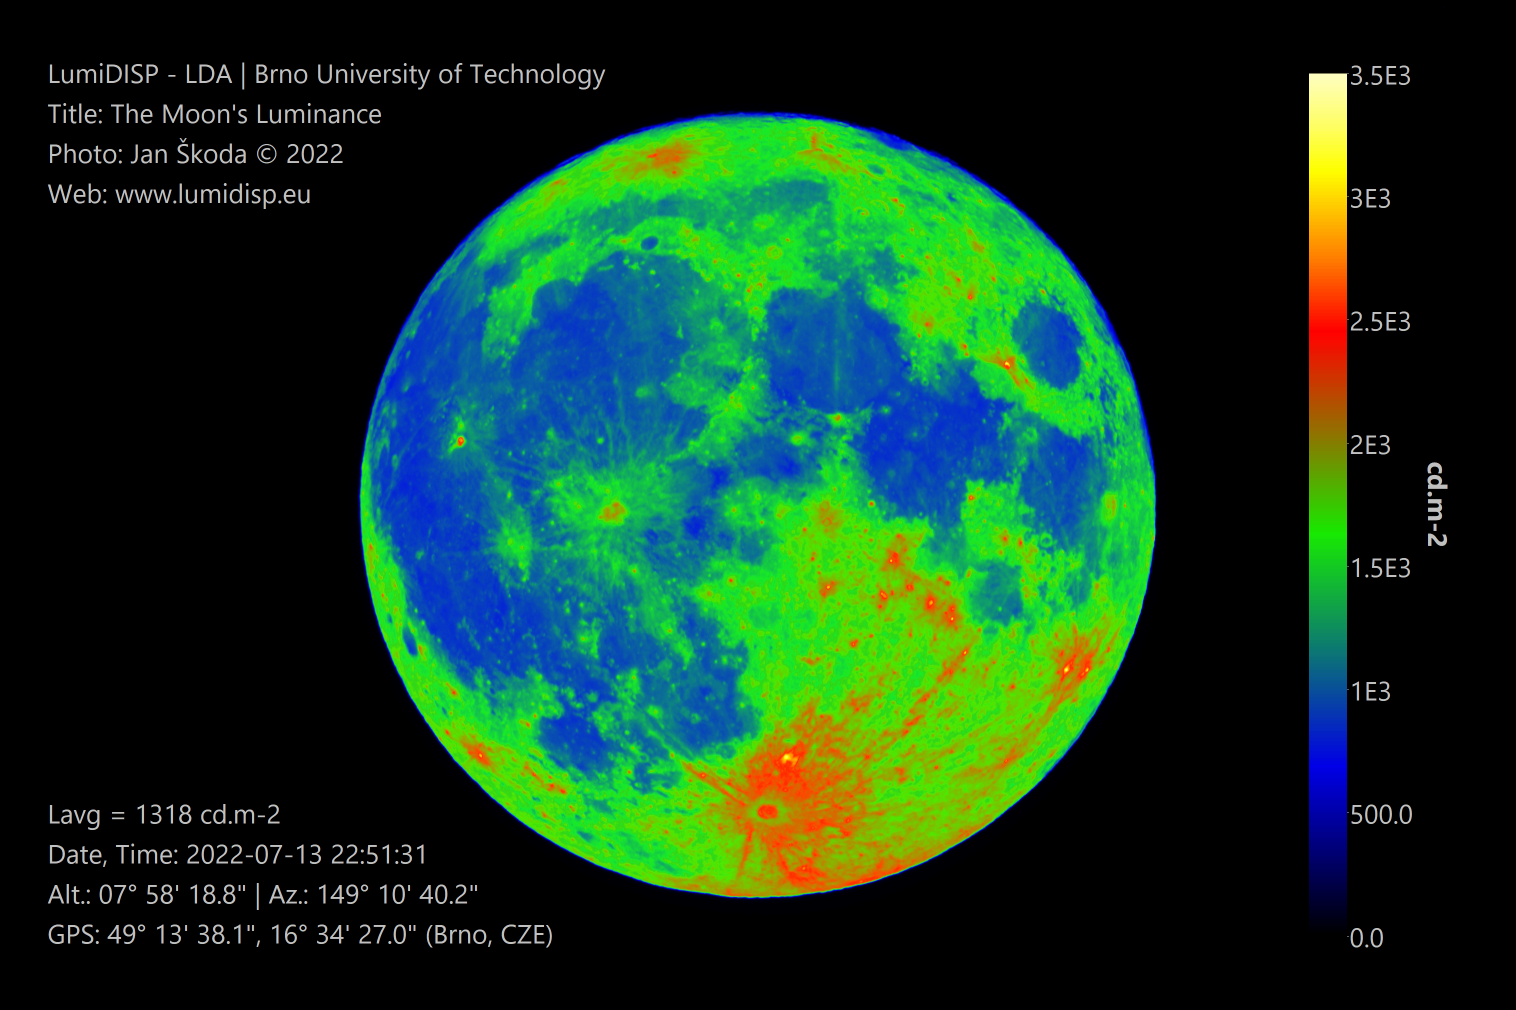
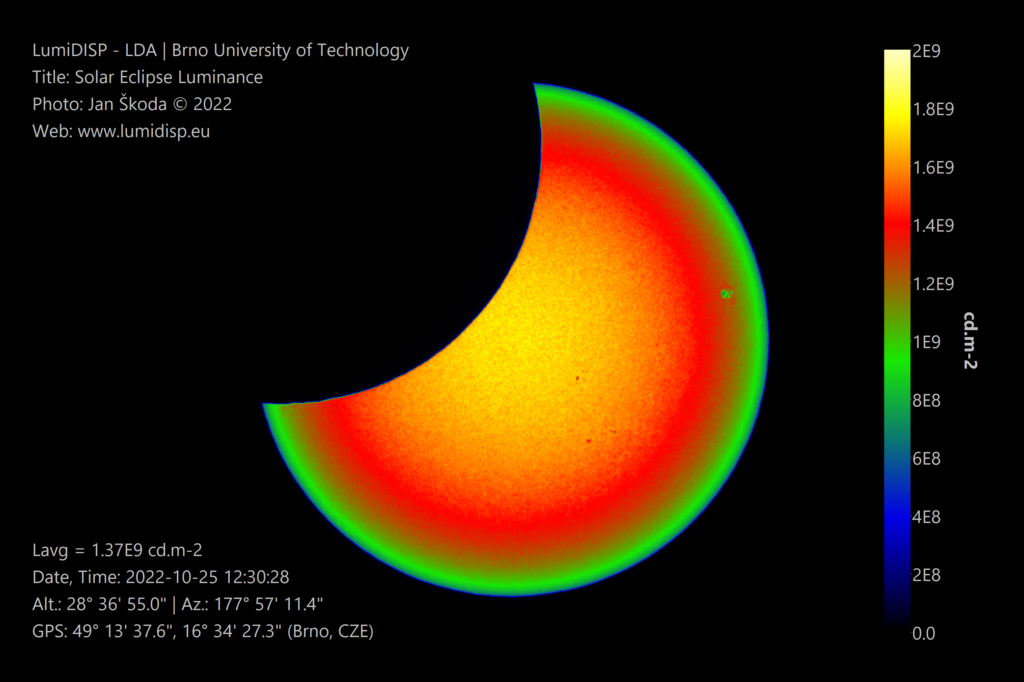
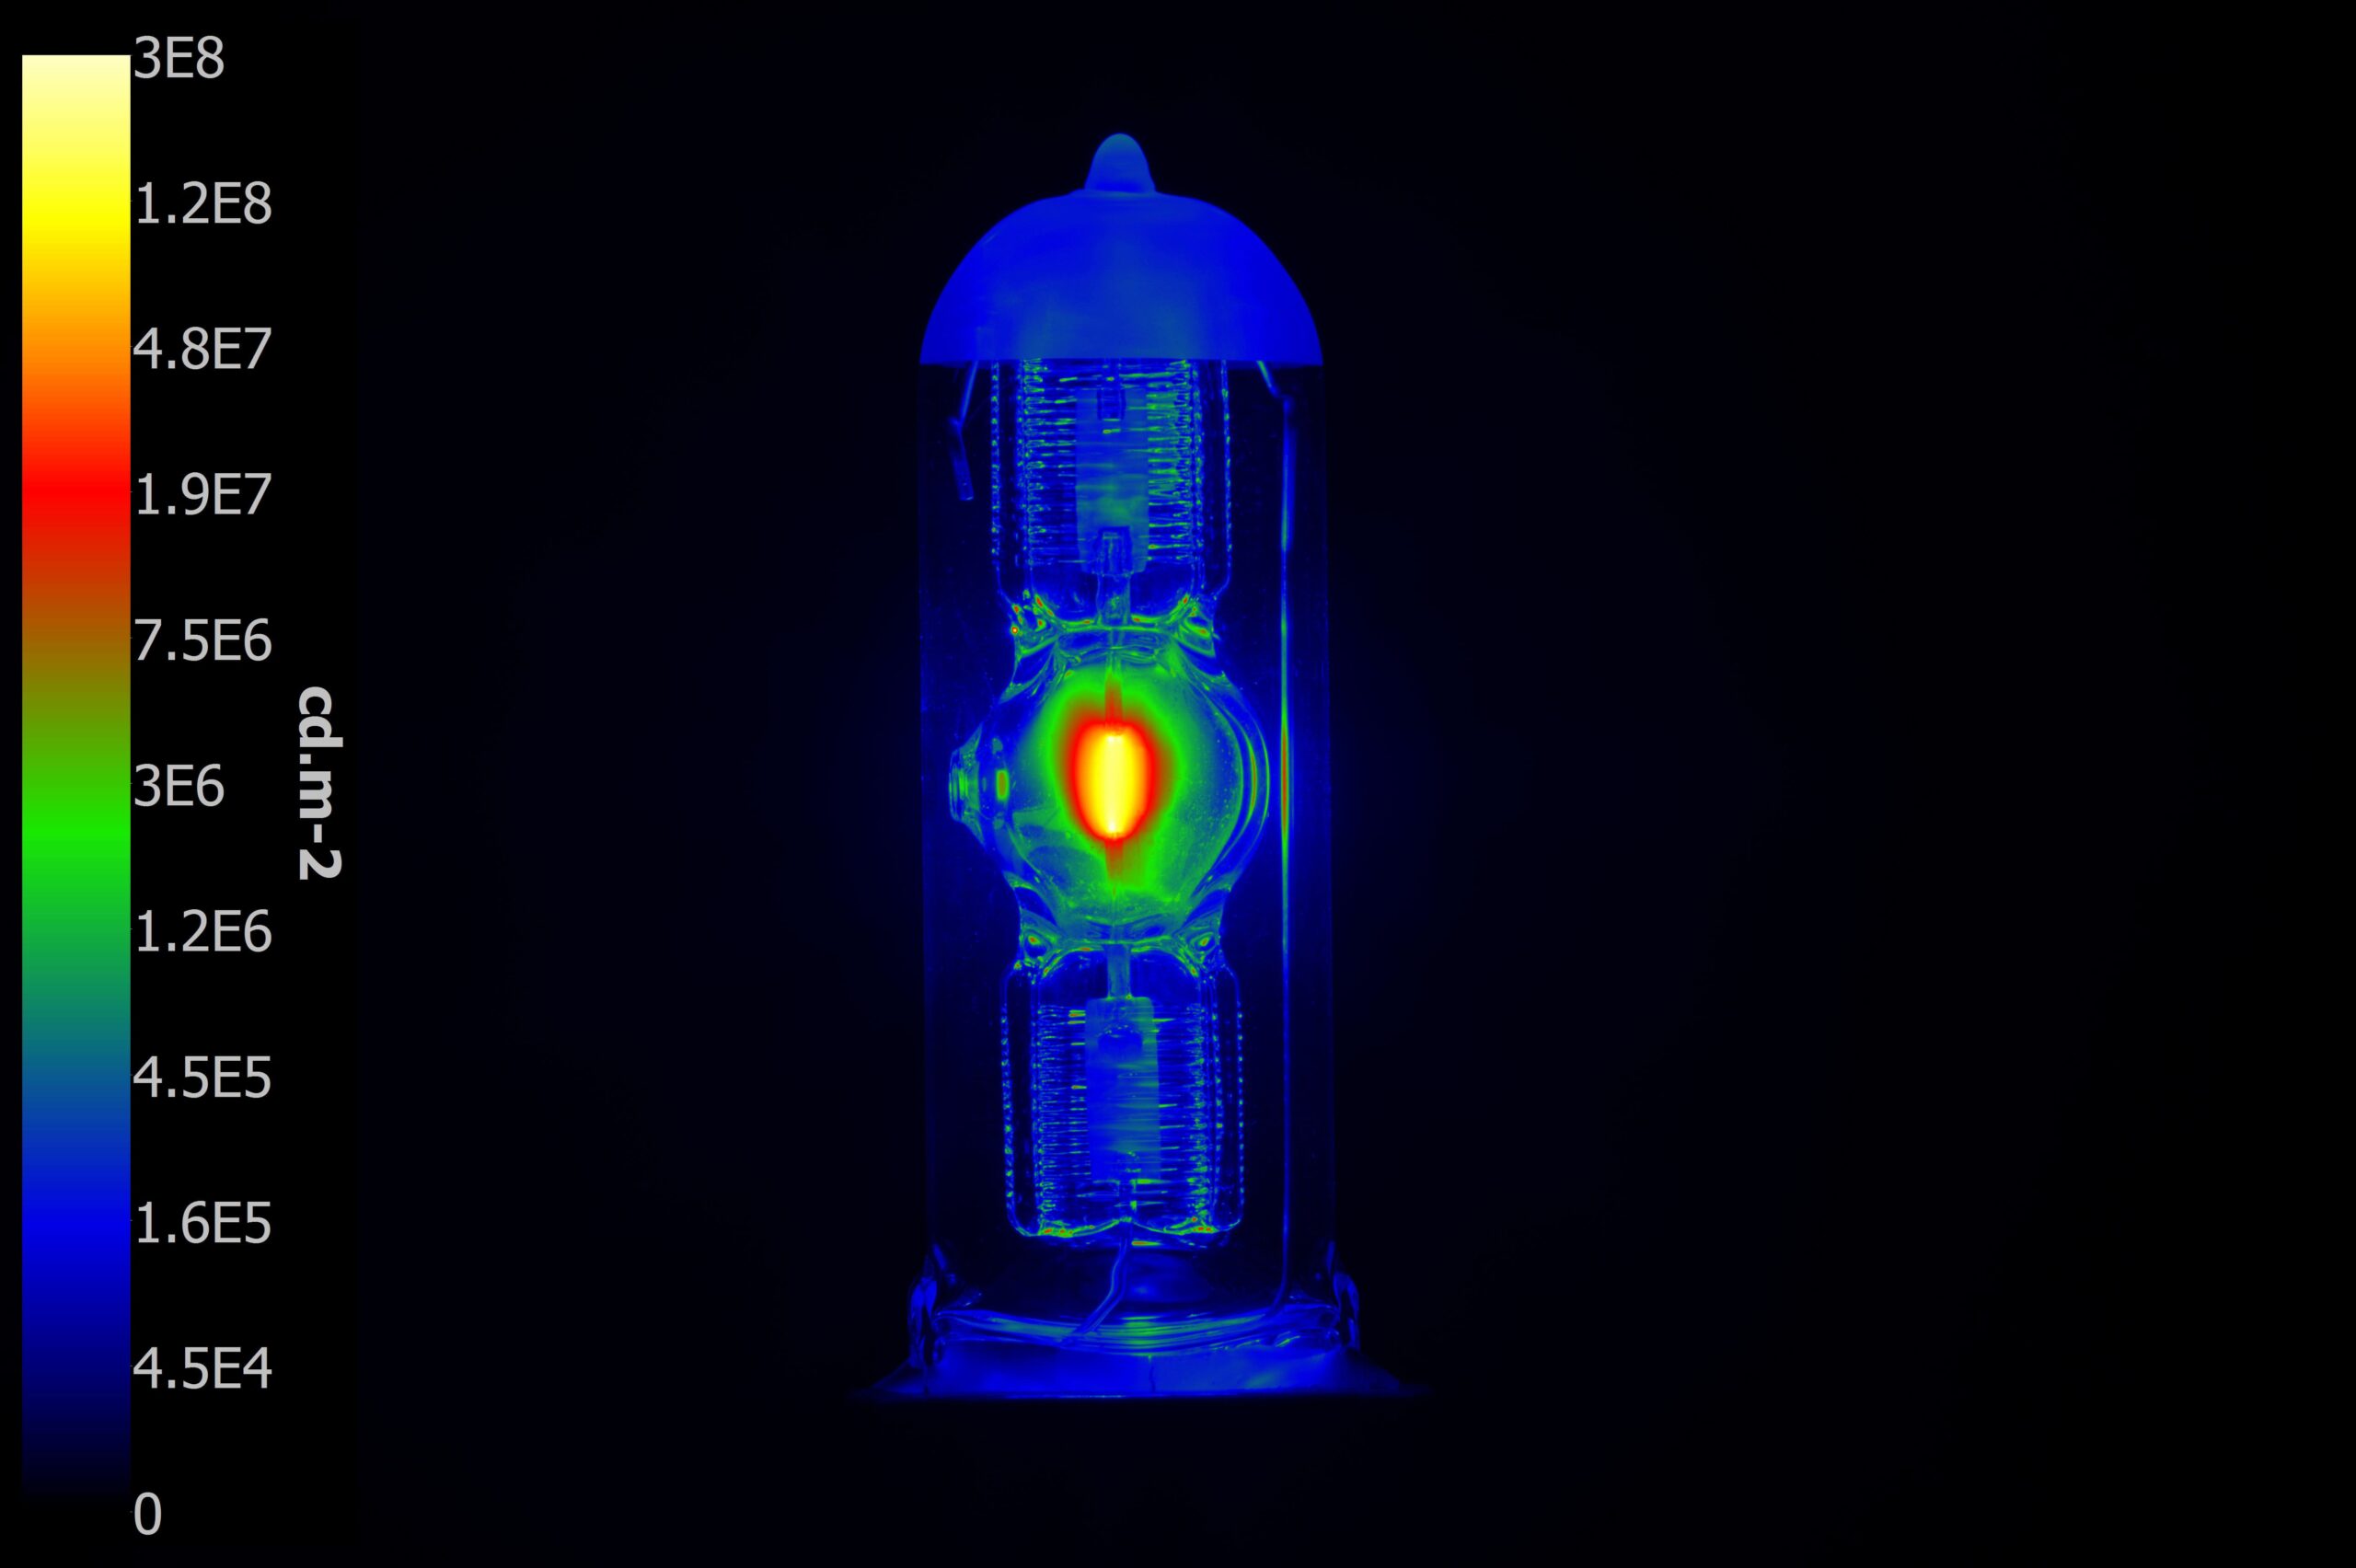
High luminance capabilities
Thanks to a state-of-the-art sensor and precision optics combined with a neutral density (ND) filter, it is possible to evaluate even extremely high luminance levels, such as the luminance of the sun. Naturally, all built-in evaluation functions can also be used for such high values in the billions of cd.m-2.
Assessment of Light Sources
Our luminance analyser technology allows you to safely observe high-intensity light sources and investigate dynamic processes that conventional spot luminance meters simply cannot detect. Using sequential scanning, you can record the ignition of a discharge lamp or evaluate changes in the discharge caused by altering the lamp’s operating position. Furthermore, you can measure peak LED luminance values, assess light distribution across fluorescent tubes, and analyse their luminance to effectively minimize glare.
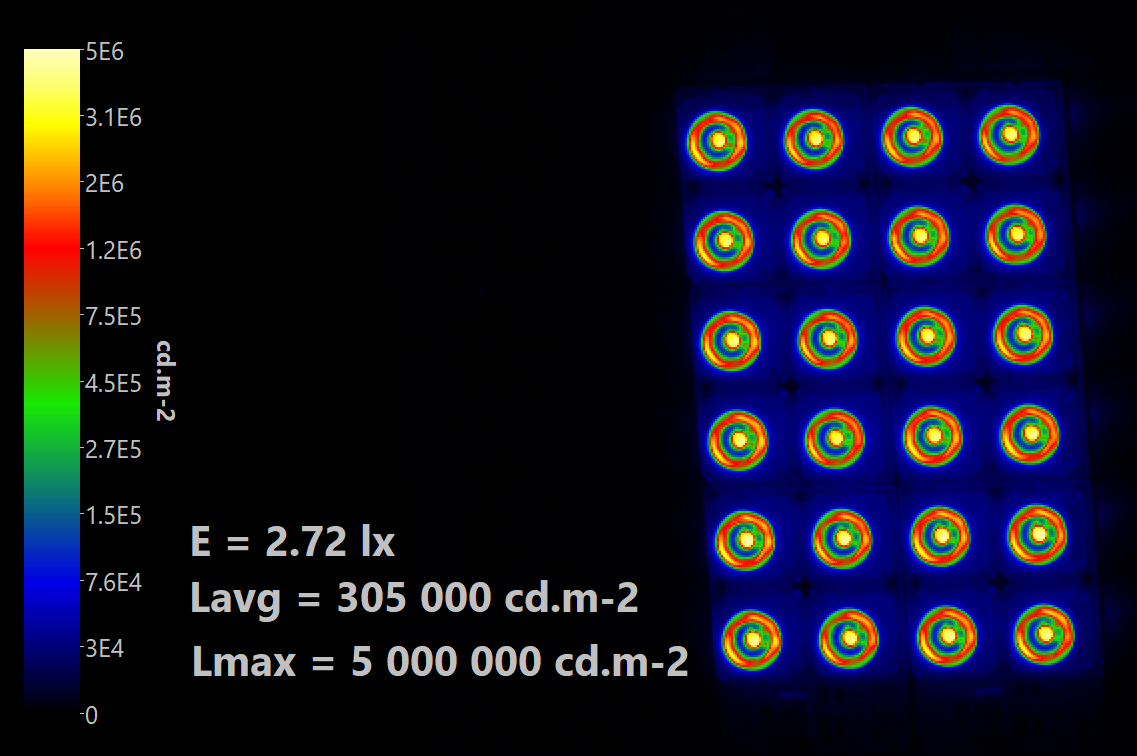
Luminaire evaluation
Luminance measurement paves the way for other advanced photometric evaluations, such as determining a luminaire’s luminous intensity. The luminance analyser captures the light distribution footprint of a luminaire. Using specialized algorithms, it then calculates the luminous intensity distribution curves, which are a fundamental parameter of any lighting fixture.
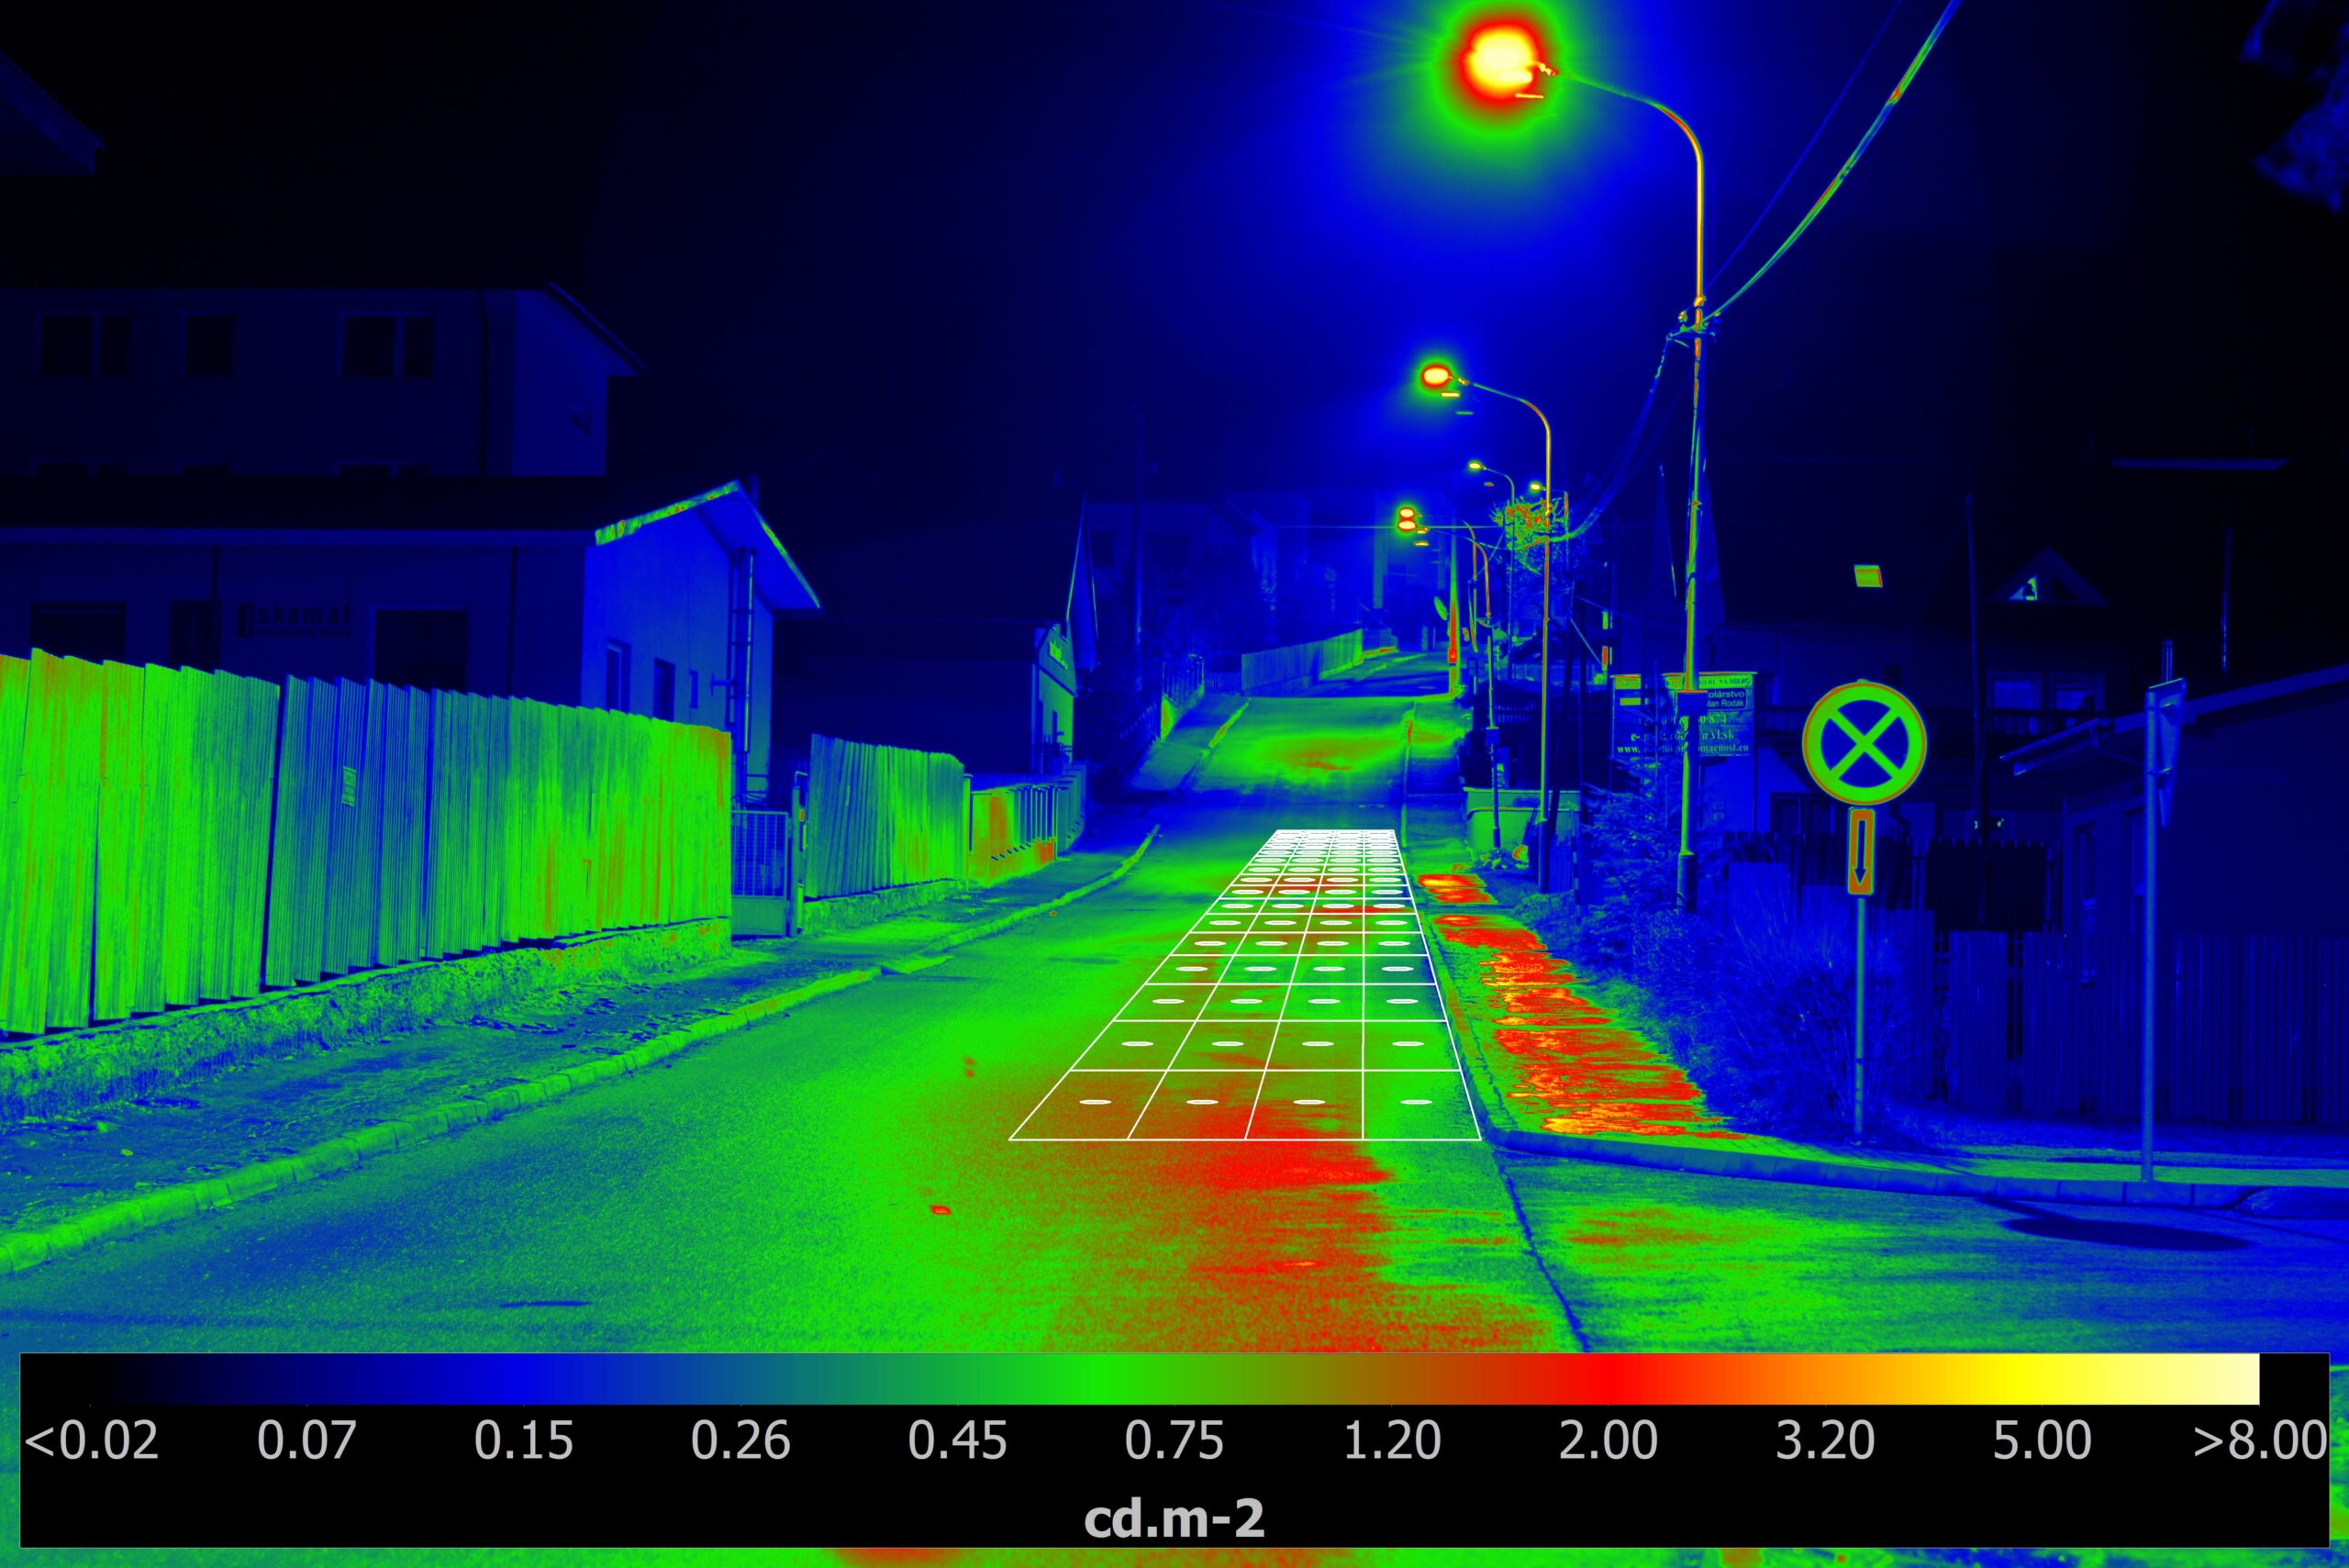
Road lighting
Luminance uniformity is a crucial metric for evaluating roadway lighting. This category encompasses all types of transport routes, from major freeways to pedestrian footpaths. Using a luminance analyser is highly recommended for several reasons, the most significant being measurement speed.
With conventional methods, measuring a single illuminated area can take hours. With our luminance analyser, it takes only seconds—completely eliminating the need for traffic closures. Subsequent data processing is seamlessly handled via computer, allowing you to easily evaluate all required metrics. Another critical and indispensable application is the analysis of tunnel lighting, particularly the transition zones at entrances and exits.
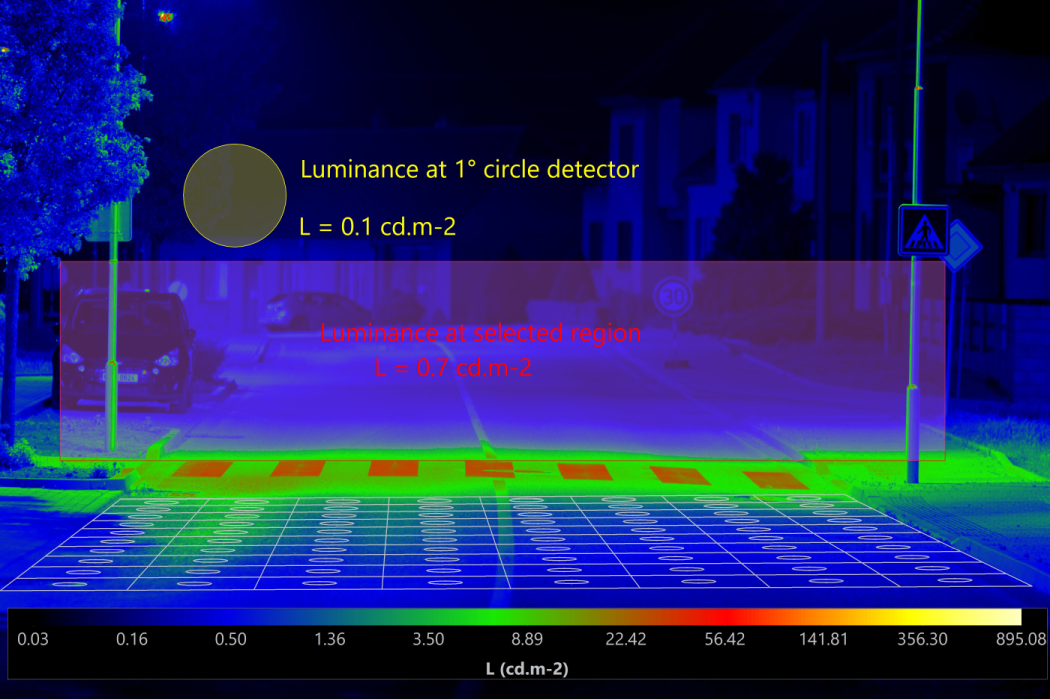
Crosswalk
Pedestrian visibility at crosswalks is a critical and frequently discussed aspect of road safety. Properly designed lighting must ensure that pedestrians are clearly visible not only on the crosswalk itself but also in the immediate surrounding area.
Applying luminance analysis here represents a generational leap in lighting evaluation. It allows us to objectively assess pedestrian visibility under existing lighting conditions, while also factoring in the impact of headlights from approaching vehicles. The key metrics monitored are the luminance contrasts between the pedestrian and the illuminated road surface. These contrasts must be high enough to guarantee that drivers can safely and reliably detect pedestrians with ample time to react.
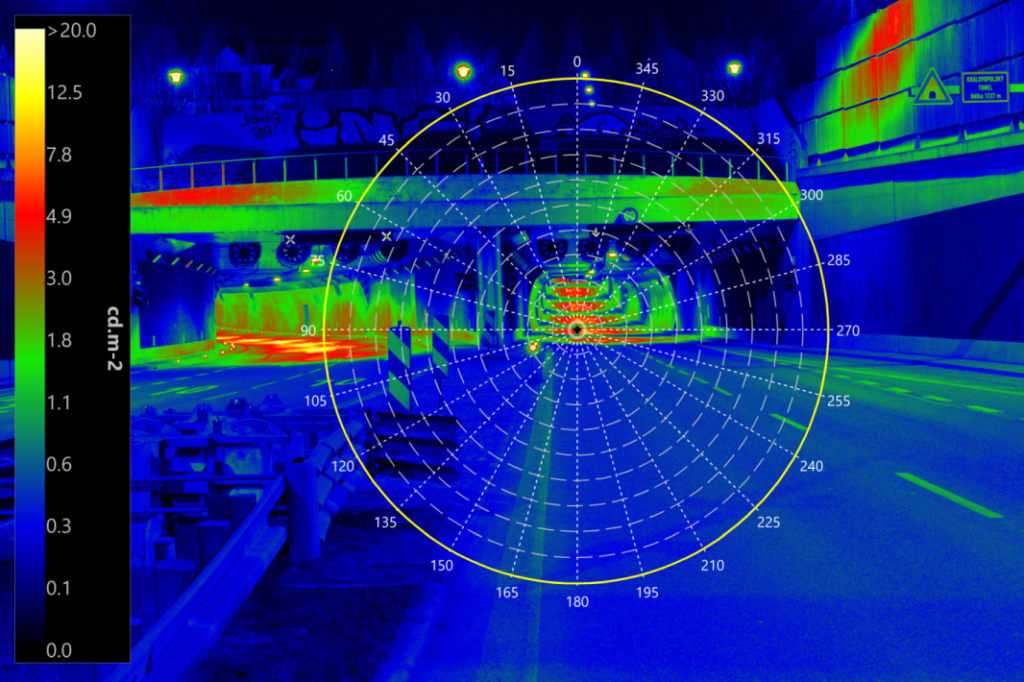
Tunnel Luminance Measurement
When paired with the appropriate optics, the analyser is ideal for evaluating luminance ratios across the entrance, interior, and exit zones of tunnels. Thanks to sophisticated processing algorithms, the 20° field of view required for this specific measurement can be positioned almost anywhere within the image frame, completely eliminating the need for additional complex geometric calibration.
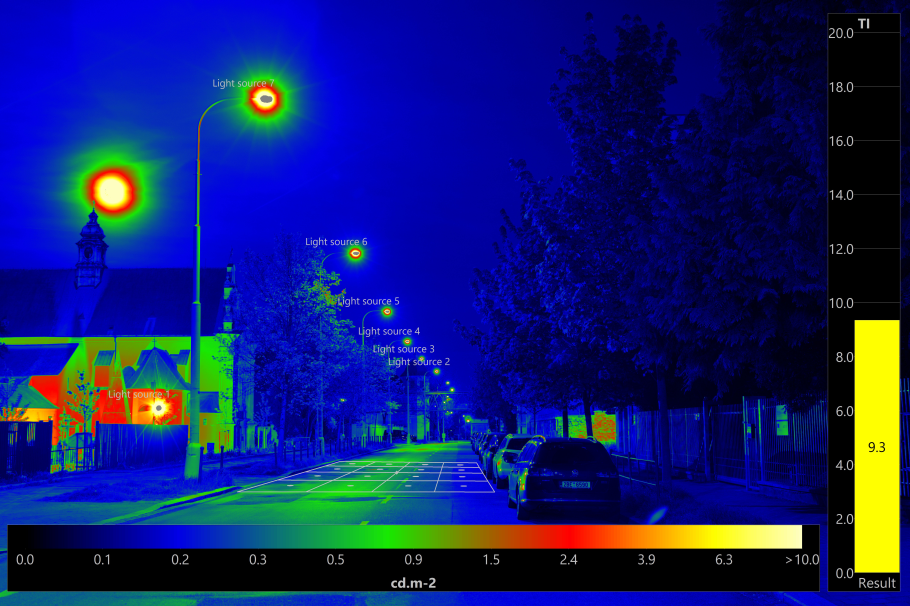
Threshold Increment (TI) Measurement
Threshold Increment (TI) is currently the standard metric used to evaluate glare on roadways. Thanks to our sophisticated algorithms, calculating TI is now both straightforward and highly accurate. The entire measurement process is fully compliant with international lighting standards, including EN 13201 and CIE 140:2019. TI evaluation is fully integrated into our current software release.
Please note: Accurate TI evaluation requires the use of an appropriate lens (refer to our technical specifications for details).
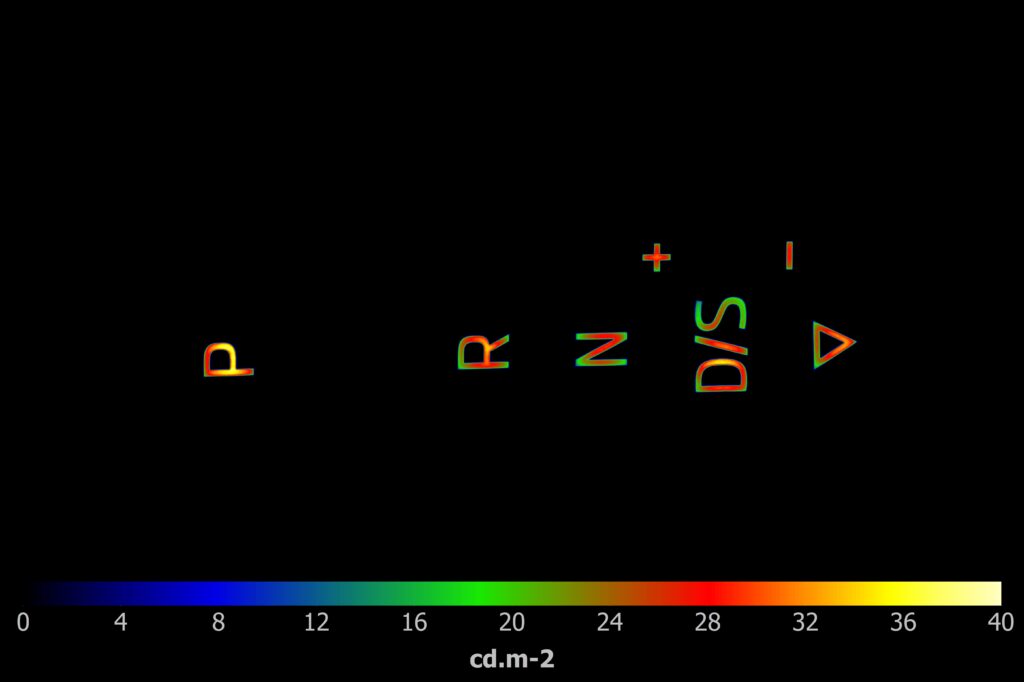
Display Device Evaluation
This application area encompasses the quality assessment of various visual interfaces, including standard monitors, screens, and in-vehicle (on-board) displays. The system is equally effective for evaluating dynamic outdoor displays, such as Variable Message Signs (VMS) used in traffic management.
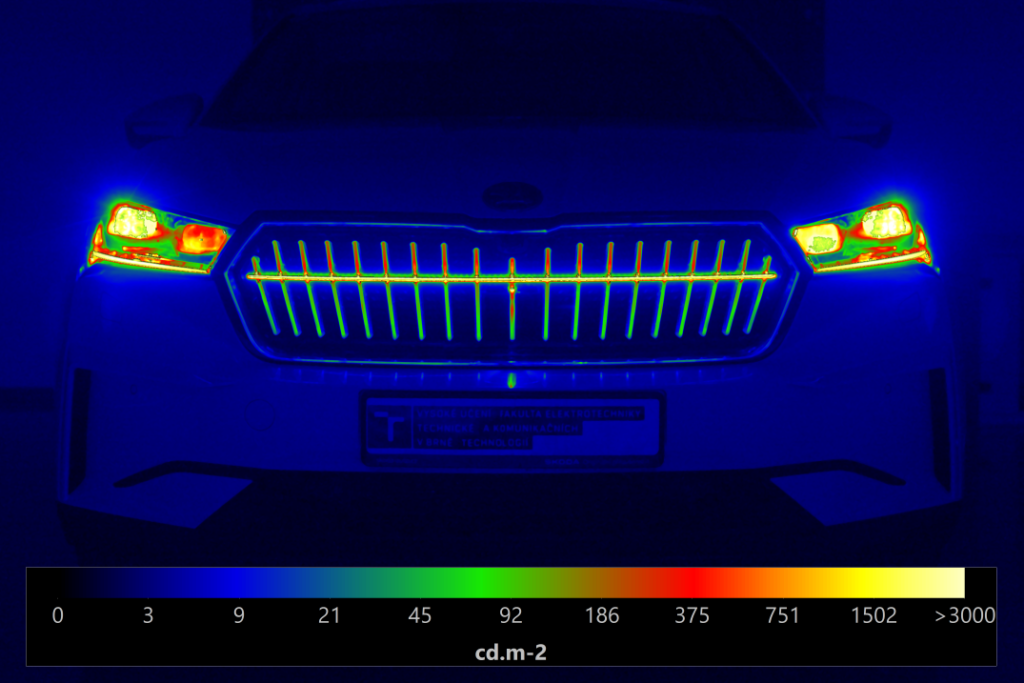
Automotive Applications
Our versatile software environment and powerful built-in arithmetic module make the analyser ideal for the rigorous demands of the automotive industry. Dedicated functions simplify complex testing procedures, including precise headlight beam analysis and headlight aimer calibration. For seamless integration into your existing workflows, the system fully supports the bulk export of binary data to any third-party software.
Contrast Analysis
Luminance contrast occurs when there is a measurable difference in luminance between two adjacent surfaces. For this contrast to be perceptible, the areas must be large enough to be resolved by the human eye, and the luminance difference must exceed the visual detection threshold. In a standard model, an observed object with a luminance of La is positioned against a background with a luminance of Lb. The resulting contrast can then be accurately calculated using the Weber contrast formula.
Glare Measurement
A similar method may be employed when evaluating glare outdoors or indoors using measuring of illuminance caused by the luminance of glaring source at the level of the observer´s eye. The software provides native support for measuring a wide range of glare indices, including UGR, GR, DGI, CGI, BGI, DGP, VCP, and Netushil’s S factor.
Light Pollution and Sky Glow Analysis
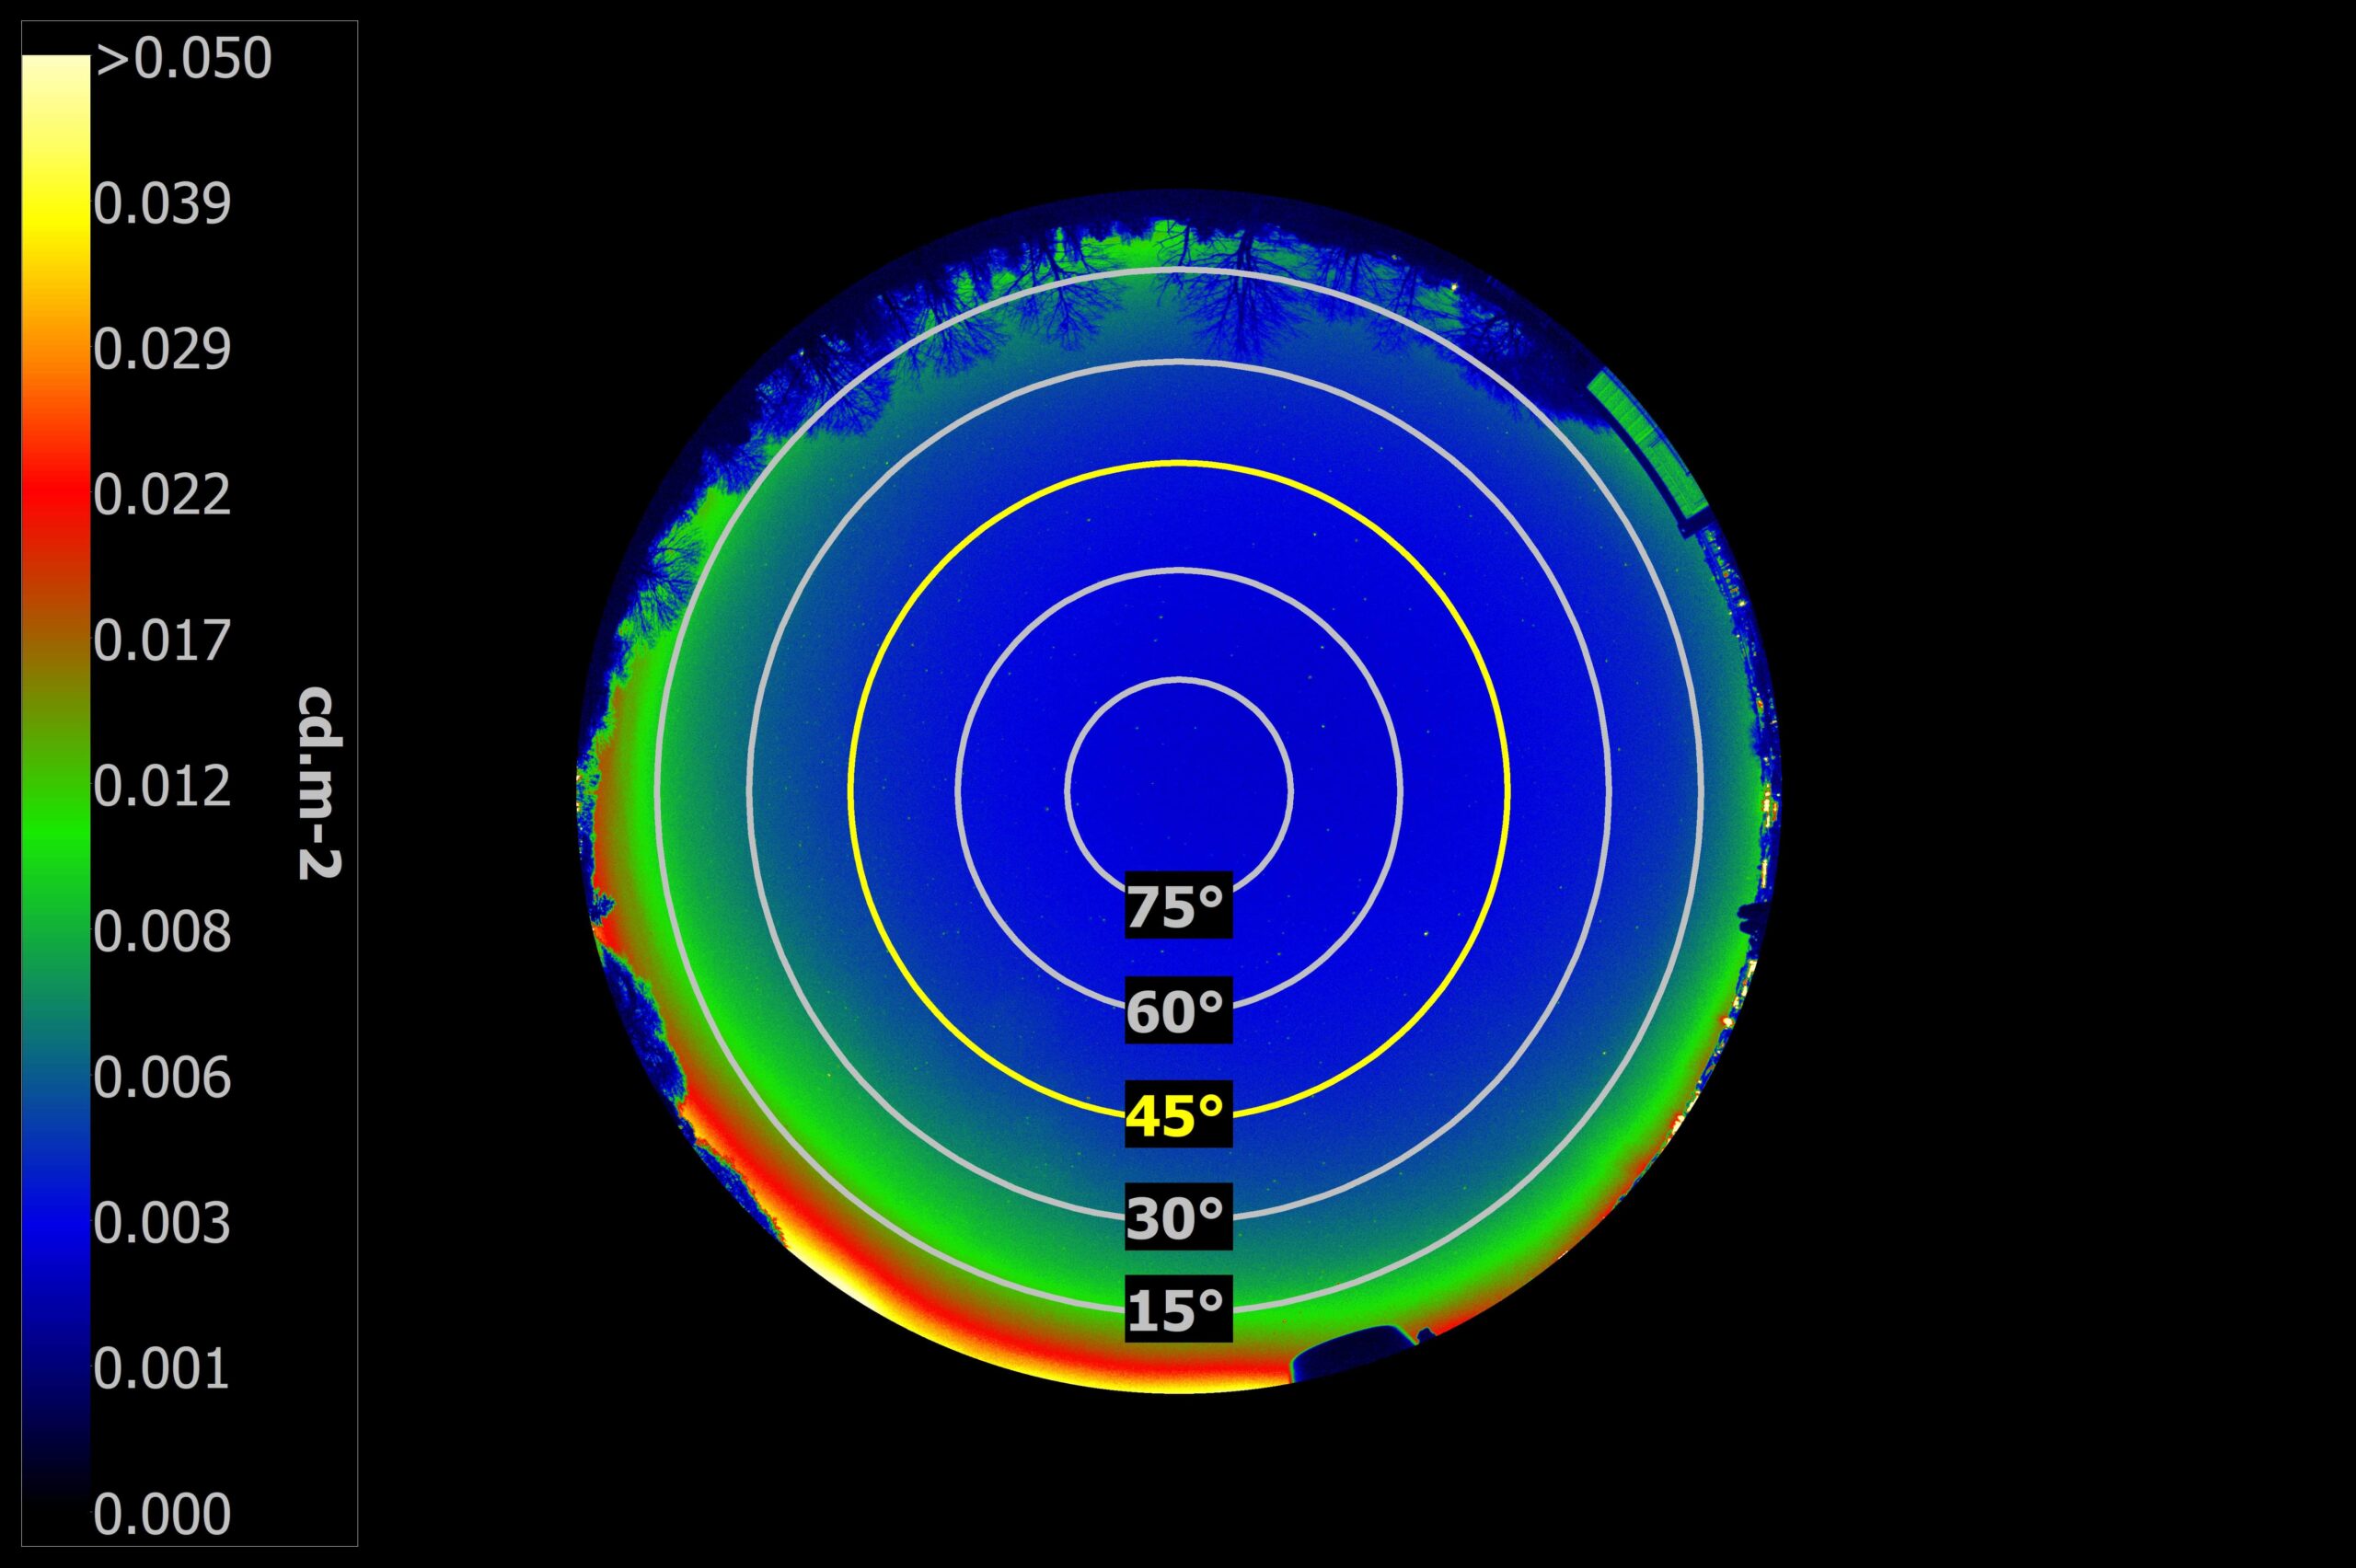
With the LumiDISP – LDA ML7 luminance meter, you can measure luminance levels so low they are imperceptible to the human eye—reaching values below 0.001 cd.m-2. This exceptional sensitivity makes the device an invaluable tool for monitoring light levels in protected nature reserves, parks, and other dark-sky zones where light pollution must be strictly controlled.
In 2021, our team participated in a landmark experiment during the COVID-19 lockdown in Brno. With 42,000 public streetlights intentionally switched off, we successfully measured and compared the direct impact of municipal lighting on sky luminance across various urban zones. Using our digital luminance analysis, researchers can accurately pinpoint specific sources of sky glow and glare, precisely quantifying their individual contributions to overall light pollution.